Freed Technologies has been using application performance management software to proactively monitor AEM implementations for close to 10 years. We review our client APM metrics at a minimum weekly to find newly introduced traffic patterns or bottlenecks in code, as well as using it as the first line of defense when an application is having performance problems that need to be investigated.
In this series of posts, we’ll share our APM knowledge for AEM, and introduce an open source framework we’ve created to enhance the data you send to your APM provider. We’ll be covering:
- Part I – What is application performance management, and how does it benefit AEM?
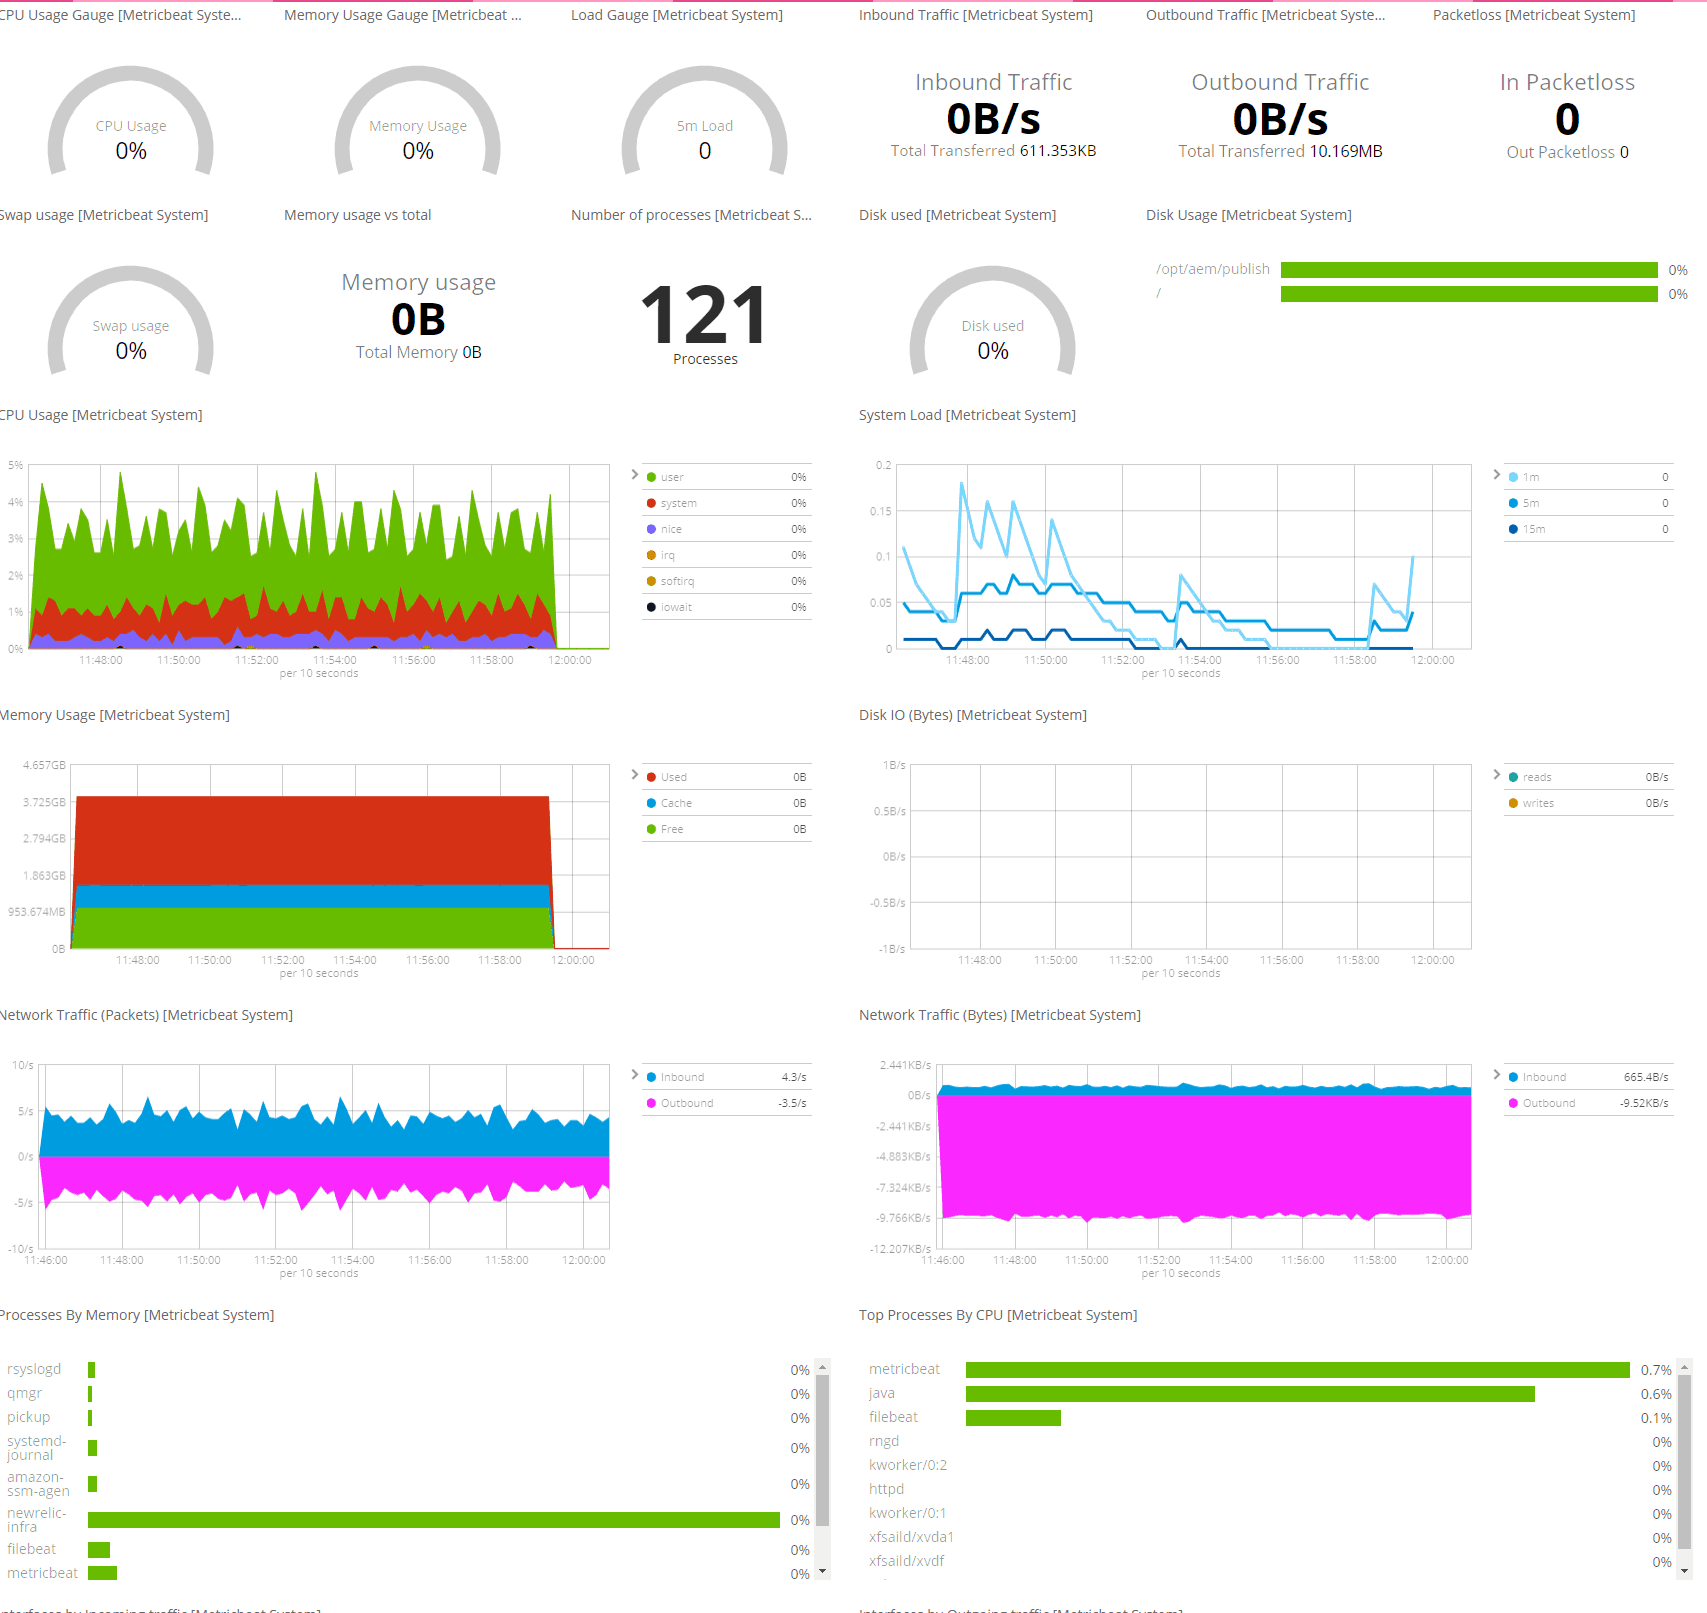
- Part II – Monitoring AEM infrastructure
- Part III – Monitoring AEM applications
- Part IV – How the Sling APM Framework helps
What is Application Performance Management?
Application performance management is a term for anything related to managing or monitoring the performance of your code, application dependencies, and response times.
Examples of metrics that are captured at the infrastructure level include:
- CPU
- Memory
- Disk Space/IO
- Network traffic
- Processes running on a server
While application level metrics for a Java application typically include:
- Java Heap usage across all heap generations
- HTTP requests made by your application
- Capturing details of non 200 responses for error analysis
- Information on response times and types of pages being rendered by your application.
These metrics are typically used in two ways to analyze your application.
Proactive
Proactive application performance management refers to benchmarking various aspects of an application. APM metrics are stored historically and graphed using APM vendor software. Periodically, site reliability engineers compare the current APM metrics to the historic benchmarks to see if the footprint of the application has changed.
For example, if historically AEM publishers run at 30% CPU during peak load, but the most recent review of metrics shows that the publishers are now running at 45% CPU during peak load, something about the application’s profile has changed to introduce more CPU. This may be caused by more pageviews being rendered by the publishers, or due to a code release that has poorly performing code. The various metrics exposed often make it obvious to an engineer what has caused the decrease in performance.
Reactive
Reactive application performance management refers to using APM metrics to notify site reliability engineers of an in-progress issue, as well as providing metrics to troubleshoot the issue. APM vendors provide the ability to setup alerts based on APM metrics. When engineers receive an alert, they can analyze the metrics to find the root cause of the issue.
Alerts are typically configured using a fixed value, or by looking at a baseline of your application and reporting abnormalities. For example, if publisher CPU typically peaks at 30%, an alert can be setup to notify engineers if CPU ever reaches 40%. If baseline alerting is used instead, an APM vendor would instead look at historical cpu metrics for the day of the week and time of the day, and if the current CPU doesn’t match the expected metrics, engineers will be notified.
What Are Some Popular APM Vendors?
Over the past several years that has been intense competition between APM vendors. Depending on the vendor, different application performance metrics are tracked. Each vendor has it’s own pros, cons and costs associated with using their software.
There are two APM vendors Freed Technologies encounters most frequently with AEM, which I’ll use as examples throughout this series:
New Relic
New Relic has been in the APM space since 2008. It provides a robust APM suite that can track infrastructure metrics, application metrics, and end user monitoring. It has alerting capabilities that integrate with email, Slack, PagerDuty and a variety of other communication tools. Each APM service for New Relic is priced separately and it is considered one of the strongest APM products in the market.
Elastic
Elastic was founded in 2009 and is an enterprise version of the open source ELK (Elastic, Logstash, Kibana) stack. Elastic can track infrastructure metrics, and recently released APM software to monitor Java application metrics and end user monitoring. It also includes log analysis, which is typically not considered APM, but is a great additional tool when analyzing APM metrics.
Elastic has alerting capabilities that integrate with email, Slack, PagerDuty and a variety of other communication tools. Since Elastic is based on the open source ELK stack, it is cost effective solution. It can be run in a data center, or organizations can instead use the Elastic Cloud service, which manages the Elastic product in AWS, Azure, or Google Cloud Platform.
Other APM Vendors
While New Relic and Elastic are the APM vendors most often encountered by Freed Technologies, many companies offer similar products. A few examples are: AppDynamics, Stackify Retrace, Dynatrace, and DataDog.
Ready to dive into infrastructure metrics? Continue to part II of this series, Monitoring AEM Infrastructure with APM.
Are you new to APM with AEM and are looking for assistance? Contact Freed Technologies to learn how we can kick start your APM efforts for AEM.